Have you ever seen a line chart in Excel that’s suddenly dropping to zero? Here’s why it happens and what to do about it:
Let’s say you have a table where you enter new sales figures every day, and a line chart connected to it. The sales figures for the last few days in the table have not yet been filled out, so the last values for the y-axis are zero. This is what the line chart could look like:
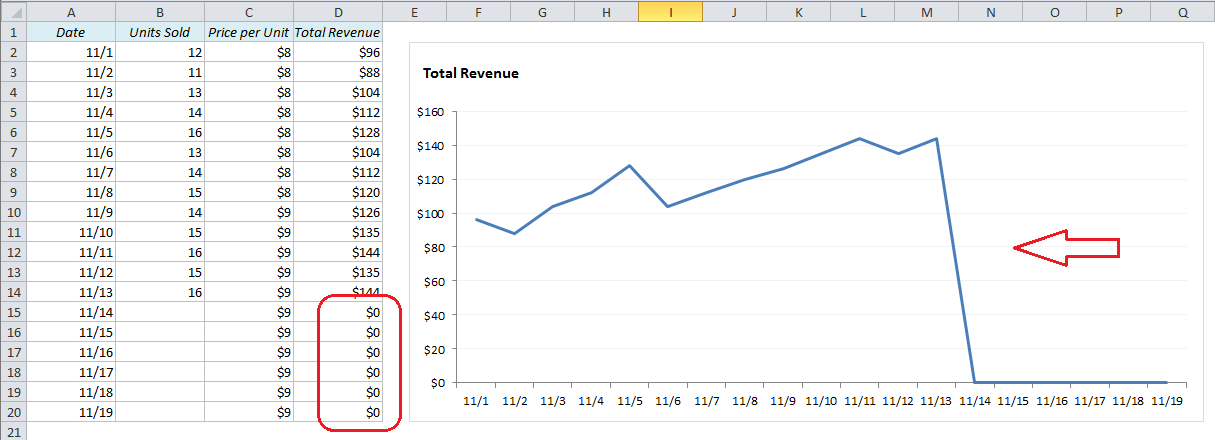
How can we get rid of this vertical line that appears after the last data entry?
The y-axis gets its data from column D, Total Revenue, which is the product of Units Sold and Price per Unit (=B2*C2, copied down). As long as we don’t have any entries for the last six days, the Total Revenue for these days would be zero. To Excel, it looks like the sales suddenly dropped from $144 to $0 overnight.
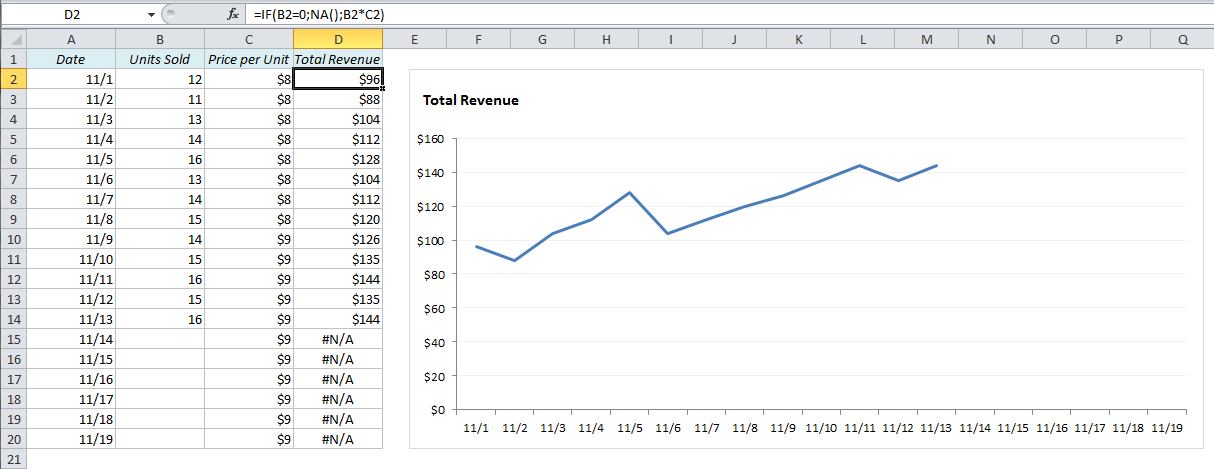
One way to solve this is to replace the zeros with #N/A. The #N/A message usually appears in lookup queries such as VLOOKUP, MATCH etc. when you search for a non-existing value, but that’s not the case here, so we have to cheat!
We’ll use a simple IF-statement in column D: IF UnitsSold = 0, then return #N/A, if not, return TotalRevenue. In Excel syntax:
=IF(B2=0,NA(),B2*C2)
…and copy down.
Problem solved!
Note 1: If you are using a non-English version of Excel, you might have to translate the function names. For example, in German, the formula in my example would be =WENN(B2=0;NV();B2*C2), and in Spanish it would be SI(B2=0;NOD();B2*C2).
Find the function names in your language here: Excel in other languages
Note 2: If you have an older version of Excel, the NA() function won’t work. Try this instead: =IF(B2=0,#N/A,B2*C2)
More on tables and charts:
- How to handle tables with empty cells in Excel
- How and Why you should use a Logarithmic Scale in an Excel Diagram
- 5 Easy Steps to Make Your Excel Charts Look Professional
- Highlight an Entire Row in Excel Based on One Cell Value
- Summarize a whole table in Excel without writing a formula
Are you using a non-English version of Excel? Click here for translations of the 140 most common functions in 17 different languages:
Catalan
Czech
Danish
Dutch
Finnish
French
Galician
German
Hungarian
Italian
Norwegian
Polish
Portuguese (Brazilian)
Portuguese (European)
Russian
Spanish
Swedish
Turkish
Brilliant. Been looking for a simple solution… didn’t expect it to be this simple. Thank you!
HI,
I’m experiencing this kind of situation as well. The strange thing, is that I have two Excel files quite similar in data tables and formulas: the first one DOES NOT draw the points/lines with no data, but the second one DOES draw the points/lines with no data.
I’ve tried this workaround in the second file, replacing the empty entries with =NA(), and does not work, the lines are always dropping to zero.
Any clue?
Br,
Fernando
Hi Fernando,
Are you using an English version of Excel? If not, you might want to try to replace NA() with the local version (NOD() in Spanish, NB() in Dutch etc.)
/Audun
Thanks for this. Excellent example with easy to understand solution
Many Thanks for a very helpful example.
Thanks, that helped!
I have been working on this problem for hours trying to figure this out. Then I ran across your post & solution. Thank you! Thank you! Thank you! Now I can go home!!
Thank you. Glad I found your post. I was looking for a solution to not plotting the first value if zero
LOL. I was attempting dynamic graphs/ pivot tables etc to solve this very problem. Decided one more Google search and this works beautifully.
Sometimes a simple method is the most powerful method.
THANK YOU!!!!!