An easier way to calculate compound interest in Excel

Do you want to calculate how much your current savings might be worth in 10 years or in 30 years? It’s an easy calculation that doesn’t require any specific function in Excel. Some simple multiplication, addition and exponentiation is all you need.

Still, the answer you will most likely get if you search for “compound interest in Excel” on Google is the FV function. The FV function is difficult to use, and it actually calculates compound interest based on a monthly rate rather than a yearly rate, which gives a slightly different result.

READ MORE

How to find cells that contain a formula in Excel

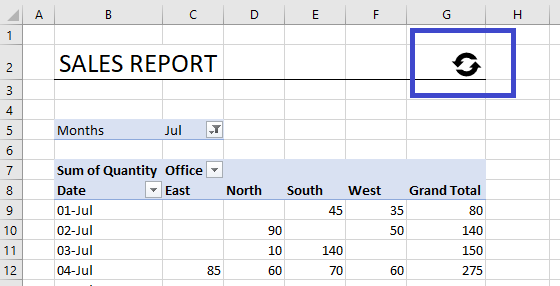
It’s a good idea to check if there are actually formulas in all the cells where you expect them to be. It happens all the time that someone accidentally has overwritten a formula with a hard-coded value, and it can be difficult to spot errors like that. Fortunately, there is a very easy way to locate all the formulas in an Excel report: The Go To Special feature.

This is what a sales report might look like. We expect to find formulas in some of the columns, but it’s almost impossible to go through the report manually cell by cell:

READ MORE

How and Why you should use a Logarithmic Scale in an Excel Diagram

Look at the diagrams below – they show the same numbers, but the vertical scales, the y-axis, are different. In this example we see how $1,000 grows to almost $300,000 in 50 years with a 12% yearly return.

The blue diagram has a linear scale on the y-axis, so the distance between 0 and 50,000 is the same as the distance between 200,000 and 250,000. The yellow diagram has a logarithmic scale with base 10, which means that each interval is increased by a factor of 10. Read more to find out how to do this in Excel, and why you may or may not want to use a logarithmic scale:

READ MORE

How to use Excel to validate a dataset according to Benford’s Law

Benford’s Law describes the phenomenon that in a large dataset, the leading digit of each number does not occur with the intuitively expected probability of 1:9 (11.1%), but rather with a much larger probability for the smaller numbers. For more details on Benfords’s Law, you can read the Wikipedia Article about it, but keep on reading here if you want to learn how to use Excel to check if a dataset is consistent with it. It’s very easy!

For this example I have used population data for all the counties of the United States from census.gov:

READ MORE

How to handle parts per million, basis points and per mille in Excel

Excel has built-in functionality to handle percent (%), but there is no automatic way to calculate parts per million, basis points, permyriad or per mille in Excel. It is easy to calculate though, but let’s start with the definitions:

And here’s how to apply it:

READ MORE