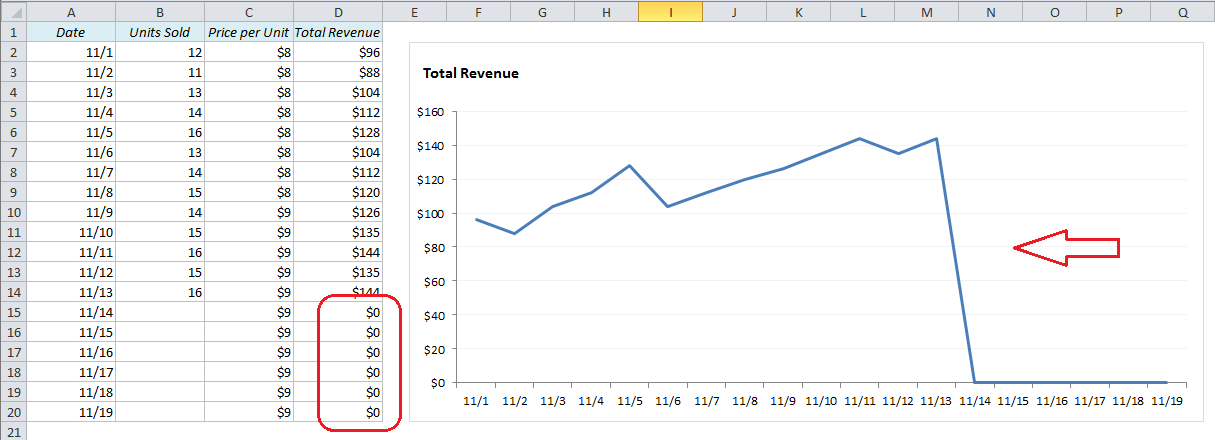
Have you ever seen a line chart in Excel that’s suddenly dropping to zero? Here’s why it happens and what to do about it:
Let’s say you have a table where you enter new sales figures every day, and a line chart connected to it. The sales figures for the last few days in the table have not yet been filled out, so the last values for the y-axis are zero. This is what the line chart could look like:
