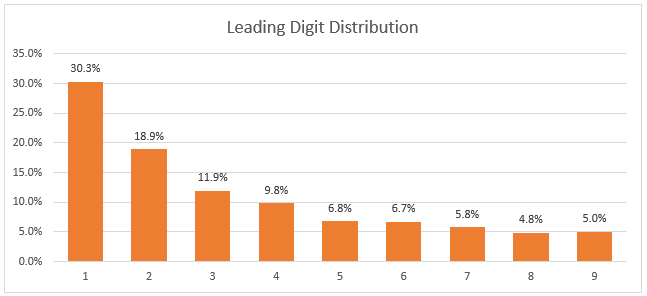
Benford’s Law describes the phenomenon that in a large dataset, the leading digit of each number does not occur with the intuitively expected probability of 1:9 (11.1%), but rather with a much larger probability for the smaller numbers. For more details on Benfords’s Law, you can read the Wikipedia Article about it, but keep on reading here if you want to learn how to use Excel to check if a dataset is consistent with it. It’s very easy!
For this example I have used population data for all the counties of the United States from census.gov:
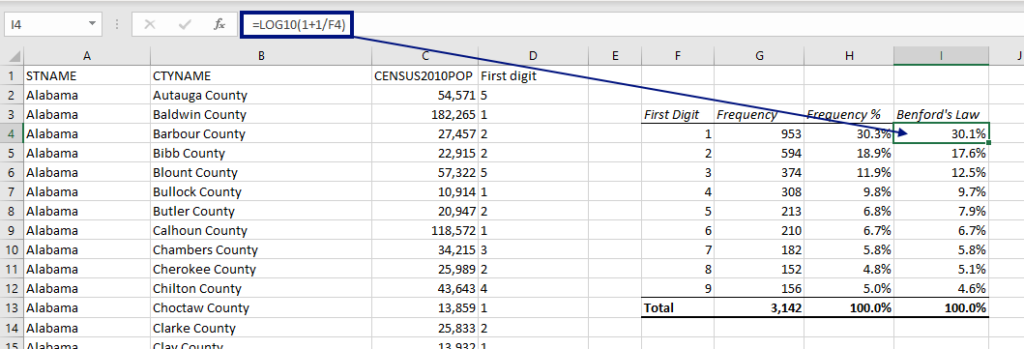
The population per county, according to the 2010 census, is in column C. I have extracted the first digit from each number in column D using the LEFT function, and copied it down.

Now, let’s make a table and look at the frequency of each digit. I am using the COUNTIF function to count how many times each digit (1 through 9) occurs in column D.

If we show the frequencies in a Bar Chart, it looks like this:

Now, let’s check our numbers against Benford’s law. The Excel formula for Benford’s Law is =LOG10(1+1/d), where d is the leading digit:

And then we add the expected distribution according to Benford’s Law to the diagram:

As we see, it’s very close, and it looks like the dataset is genuine.
This law applies to a lot of different kinds of data, but not all! For example, a random list of telephone numbers, invoice numbers or other numbers created deliberately by humans would not have this distribution. Neither would a list of prices in a shop where most products cost between 20 and 60 dollars. Or in elections, where the electoral precincts are usually quite small: If most of the voting districts in a county have less than 2000 inhabitants, an unproportionate number of districts will have 1 as the leading digit, and if there are two canditates in the election, there would probably be a larger prevalence of larger leading digits (from vote counts between 500 and 999).
More Excel tutorials:
- How to Create a Refresh All Button in Excel
- How to Find Duplicates and Triplicates in Excel
- Create a report in Excel in 5 minutes – Beginner’s tutorial
Are you using a non-English version of Excel? Click here for translations of the 140 most common functions in 17 different languages:
Catalan
Czech
Danish
Dutch
Finnish
French
Galician
German
Hungarian
Italian
Norwegian
Polish
Portuguese (Brazilian)
Portuguese (European)
Russian
Spanish
Swedish
Turkish