Even if you have never used Microsoft Excel before, it only takes 5 minutes to learn how to make a simple report. Once you have done the exercise below, you will be able to create your own sales reports, commission reports, or household budget.
In this post we will create a sales report in 5 steps. You will be amazed by how easy it is!
Let’s get started!
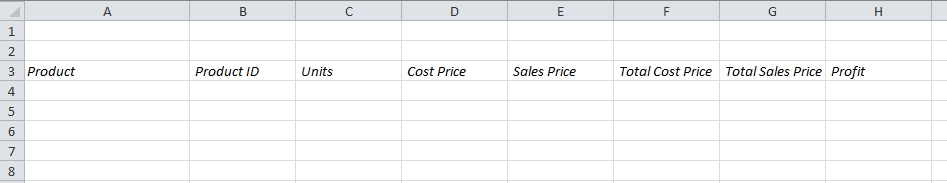
1. Create the Categories
Decide which categories you want to include in the report. Always start on the third row, to leave room for the headlines on row 1 and 2. I have chosen the categories Product, Product ID, Units, Cost Price, Sales Price, Total Cost Price, Total Sales Price and Profit:
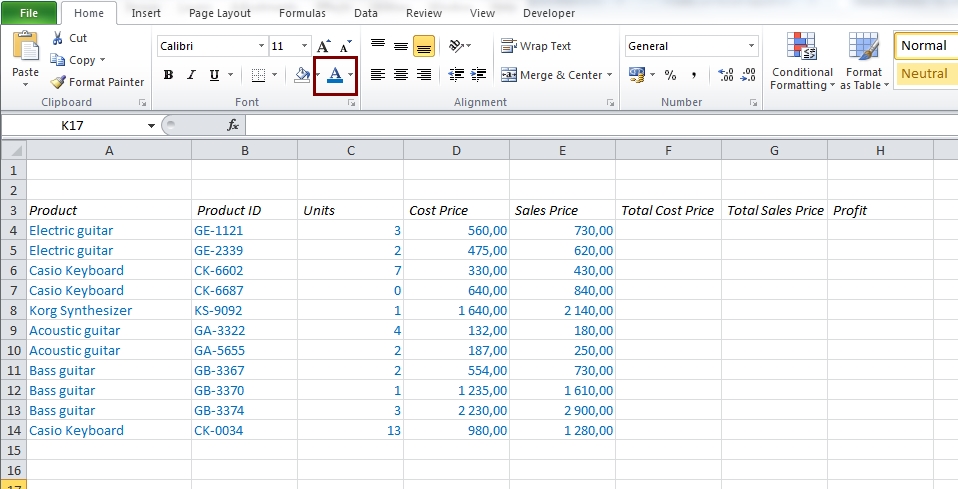
2. Enter the data
Type product names and IDs, number of units, and prices. These are our Assumptions, and I always choose a blue font to show that clearly.
3. Write the formulas
And now for the fun part: The formulas!
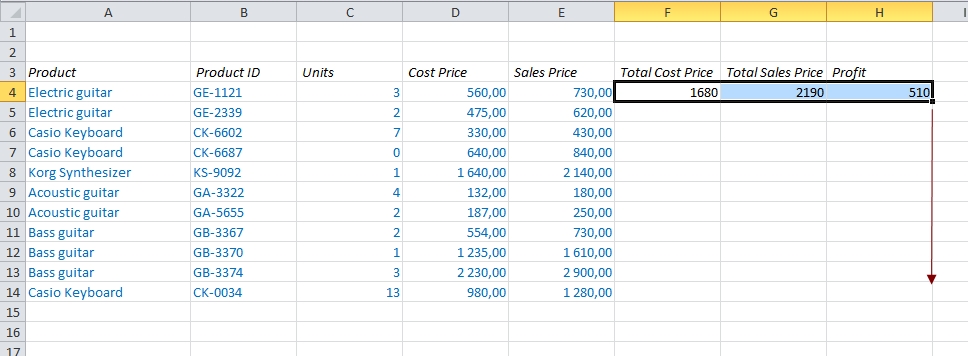
A formula in Excel always start with an equal sign (=). If you type =2+2 in a cell, it will display 4, and if you type =3*3, it will display 9. But in Excel, instead of using hard-coded values in our formulas, we use references to other cells. For example, to calculate the total cost price, we have to multiply the cost price per item by the number of items. For the first Electric Guitar the total cost price would be 3 x 560 = 1680, or Cell C4 x Cell D4 = 1680.
Let’s do it:
- Total cost price: Select cell F4 and type =C4*D4.
- Total sales price: Select cell G4 and type =C4*E4
- Profit: Select cell H4 and type =G4-F4
You only have to write each formula once! When you’re done, select all three cells and move the mouse to the little square on the right side of the rightmost cell and drag down. This will copy all the formulas all the way down
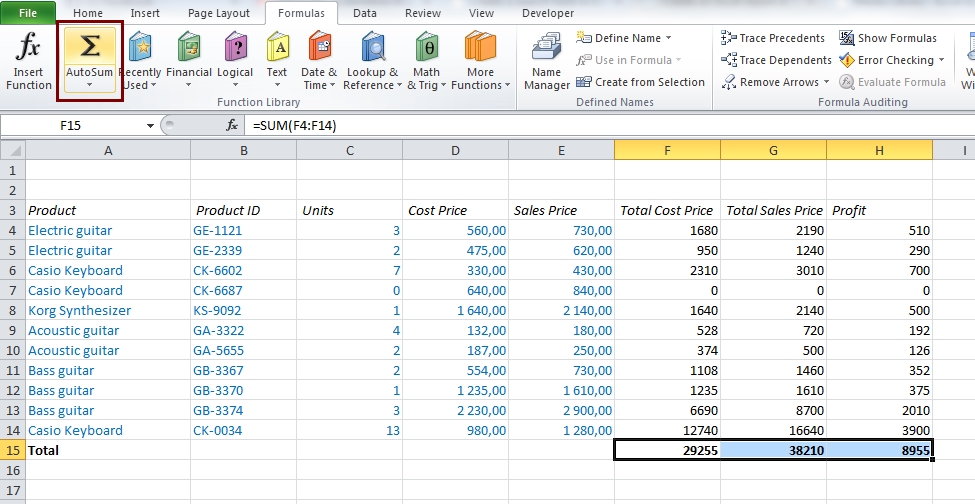
4. Add the totals with Autosum
Type Total below the last row of the report (cell A15). Select the cells F15, G15 and H15 and click on the Sigma (Σ) symbol on the Formula ribbon.
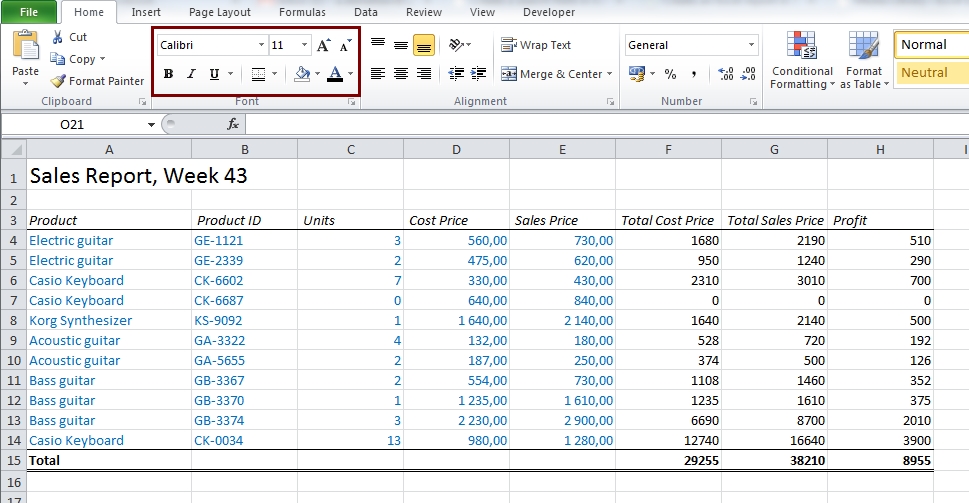
5. The last touch – Heading and formatting
To make the report look like a report, you should add some lines and a heading – just experiment with the different options on the Home ribbon! Here’s my suggestion:
Are you using a non-English version of Excel? Click here for translations of the 100 most common functions.