How to use Excel to validate a dataset according to Benford’s Law

Benford’s Law describes the phenomenon that in a large dataset, the leading digit of each number does not occur with the intuitively expected probability of 1:9 (11.1%), but rather with a much larger probability for the smaller numbers. For more details on Benfords’s Law, you can read the Wikipedia Article about it, but keep on reading here if you want to learn how to use Excel to check if a dataset is consistent with it. It’s very easy!

For this example I have used population data for all the counties of the United States from census.gov:

READ MORE
How to Calculate Grades in Excel

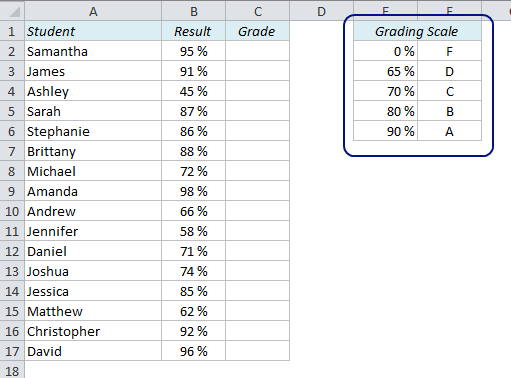
How can we calculate the grades (for example A-F) in Excel if we have the test results as numbers? In the example below, a score of 90% or higher is an A, 80-89% is a B, 70-79% is a C, 65-69% is a D and less than 65% is an F.

The first thing we should do is to organize this information in a lookup table:

EasyExcel_39_1_Calculate grades in Excel


READ MORE

How to protect cells in Excel

Why it’s important to protect cells in Excel

If you create an Excel report for someone, it is important that you somehow visualise which cells they are allowed to change, and which cells they should not touch. The common way to do this is to use a blue font for the assumptions, i.e. the values that can be changed.

Unfortunately, this is not always enough. Inevitably, someone will try to enter values into the calculation cells as well, and when they do, the whole report might be useless. We need to protect the cells from being tampered with, and the good news is that it takes less than a minute!

READ MORE

How to Find Duplicates and Triplicates in Excel

Is there an easy way to locate and highlight duplicates in a list in Excel?

If you just want to remove the duplicates, the easiest way is to use the Advanced Filter or the built-in Remove Duplicates feature on the Data ribbon, but what if you want to find the duplicates in the list, keep them and highlight them with a different colour? That almost sounds like a job for a professional Excel consultant, but there’s no need for that – you can easily do it yourself! I’ll show you one easy way and one super-easy way:

READ MORE

How to Create an HTML Table with Excel

If you write something for a webpage, chances are that you write the text in HTML code. If you’re used to it, it often turns out to be easier than writing the text in a What-you-see-is-what-you-get-editor (WYSIWYG). In my experience, the WYSIWYG-editors never really work the way you want, so the HTML editor turns out to be better after all.

But what if you want to use a table that you have created in Excel? How can you transform an Excel table into a piece of HTML code that looks like this?

READ MORE

5 Easy Steps to Make Your Excel Charts Look Professional

Why do Excel charts usually look so ugly? Ok, they look a lot better in newer versions of Excel than they did before, but you still need to make a few changes if you want them to look good enough for a presentation.

These are the 5 things you can do to make your Excel chart look professional:

READ MORE